Introduction & Navigation
Our Reports tab provides you with ad revenue and engagement statistics for each of your apps. Here’s a quick look at its layout:
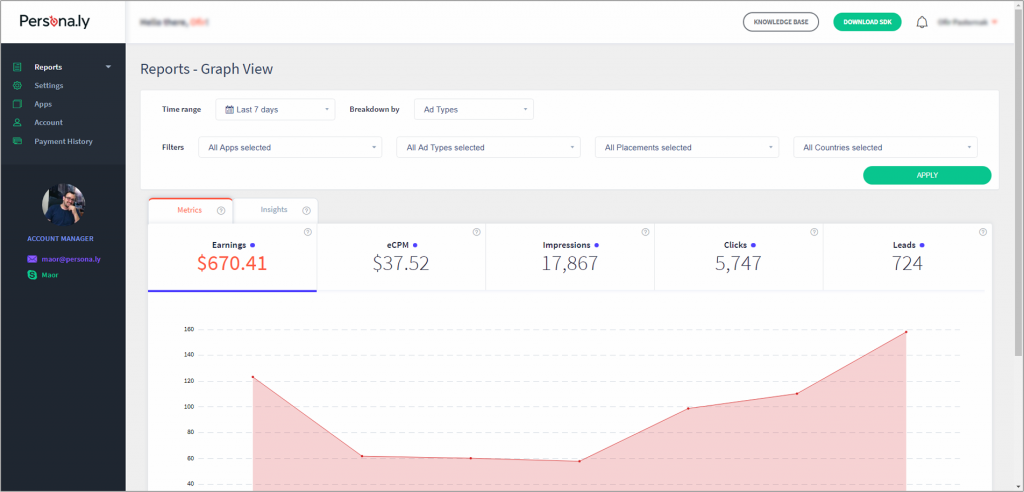
In order to produce a report, pick a date range, a breakdown, and any filters if required.Use these tools to find the specific statistics you need.
- Time Range: Choose the time frame that you want to get stats for. Select one of the pre-defined ranges or create a custom date range.
- Breakdown By: Segment your stats by apps, devices, ad types, and placements.
- Filters: Filter by apps, ad units, ad placements or countries.
The following statistics are available on our dashboard:
- Earnings – Your earnings in USD.
- eCPM – Your earnings per 1000 impressions
- Impressions – The number of fetched ads
- Clicks – The number of clicks made by end-users.
- Leads – The number of executed transactions.
- Fill Rate – Indication of the demand side’s capability to serve ads. Calculated as follows:
(successful requests / total requests) * 100
- CVVs – completed video views
The information is available in two view types:
- Table View – Allows you to view your data organized as a table according to your selected filters and breakdowns, with the ability to export the data in CSV format.
- Graph View – Allows you to view your data organized in a graph according to your selected filters and breakdowns, allowing you to notice trends visually.
To switch between table and graph view, click on ‘Reports’ in the left navigation window and select a view.