Your source for everything mobile UA, from the basics to contentious standards, the glossary can help and inform both aspiring growth managers and experienced mobile app developers


Performance metrics
App Growth Metrics – The Key User Acquisition Metrics To Follow -> Page 1 of
App Growth Metrics – The Key User Acquisition Metrics To Follow

When tracking the performance of in-app mobile marketing campaigns, there are endless dimensions and a lot of metrics to consider. Before you start looking at the data, it’s better to gain an understanding of which data you want to be looking at, and what should be considered when analyzing the data.
Metrics can be divided into different categories, the ones we’ll be referring to in this article are initial and cost-related KPIs, with a distinction between pre-install and post-install KPIs. The second part of metrics KPIs refers to value-based metrics, which we’ve covered in The Cornerstone KPIs for Mobile UA and include retention rate, ARPU, ROAS, and LTV.
Why Pre-install Metrics Matter
Pre-install metrics help gain early knowledge of the performance of the campaign. While an install may not be the goal for most marketers (KPIs will usually focus on ROAS, whether it’s dependent on retention or deposits), it’s still a significant performance indicator.
While most marketers focus heavily on conversion rate (impression to click), we argue that there are other, more reliable, early indicators that can be used to predict the performance of the campaign, such as IPM (install per mille).
Before full transparency became the standard for marketers, granular data wasn’t as accessible as it is today. App marketers had to rely on conversion rates and other pre-install metrics in order to estimate the quality of their partners. Based on the data, marketers chose their partners and allocated the highest spend to those who showed to bring the most engaged users in the promise of growth potential and quality.
These days, when granular data is available, and when there’s more transparency, CR (conversion rate) is not as meaningful as it once was but both pre and post-install data are considered at every stage of a user acquisition campaign. CPI (cost per install) and the metrics around it aren’t the one size fits all solution that they used to be, but they should still be optimized towards, within reason, without compromising the performance down the funnel.

Thank you for your interest!
Our team will contact you with more details.
Considering Ad Spend - Scalability and Relative Success
Ad spend is not a measure of performance in and of itself but it still plays a role when you weigh performance. A campaign with more spend but lesser results might still be better than a campaign with less volume and better relative results.
To exemplify it, we’ll use two fictional campaigns:
- Campaign A had a budget of $100 and delivered 30% D7 ROAS.
- Campaign B had a budget of $1000 and delivered 20% D7 ROAS.
When you look at ROAS alone, campaign A delivered better results than campaign B but if you look at the revenue, campaign A’s revenue was $30, whereas campaign B’s revenue was $200.
Campaign B delivered higher revenue by utilizing a bigger spending budget. Since it’s not a given that campaign A is scalable, campaign B is the better-performing one, in this instance.
If campaign A can deliver the same quality of results with x10 the budget, it’d be the better-performing campaign.
The takeaway here is that the quality of the campaign is related to its scale and should be measured against it.
CPM (Cost Per Mille), dCPM (Dynamic Cost Per Mille) and eCPM (Efficient Cost Per Mille)
In programmatic media buying, where advertisers pay for impressions, the price is normally set in CPM (Cost Per Mille, where “Mille” is the Latin word for thousand). CPM is a common metric used in advertising to denote the cost of 1,000 impressions or views of an advertisement. It measures how much an advertiser pays for a thousand impressions of their ad.

For example, if an advertiser pays $500 for 100,000 impressions, the CPM would be calculated as follows:
CPM =($500/100,000)*1000 = $5
So, in this case, the cost per thousand impressions (CPM) is $5.
CPM is commonly used in digital advertising, where advertisers pay for the number of times their ad is displayed to users, regardless of whether they click on it. It provides advertisers with a standardized way to compare the cost of reaching their target audience across different websites or advertising platforms.
In the world of programmatic, it’s also not uncommon to hear dCPM and eCPM. dCPM (Dynamic Cost Per Mille) and eCPM (Effective Cost Per Mille) are both metrics used to measure the cost of 1,000 impressions. However, they represent different aspects of the advertising performance.
dCPM (Dynamic Cost Per Mille)
dCPM is a bidding strategy used in programmatic advertising. It refers to the maximum amount an advertiser is willing to pay for 1,000 impressions, and this amount can change dynamically based on the likelihood of conversion or other specified goals.
The bidding is adjusted in real time based on the predicted value of each impression, aiming to maximize the ROAS.
eCPM (Effective Cost Per Mille)
eCPM is a metric that represents the estimated revenue for a publisher (app developer) per 1,000 impressions. It is calculated by dividing total earnings by the number of impressions and then multiplying by 1,000.
eCPM provides an effective way to compare the revenue generated from different advertising channels or platforms, regardless of the pricing model (e.g., CPC, CPM, or CPA).
In summary, dCPM is related to the bidding strategy in programmatic advertising, where the cost per mille can vary dynamically based on certain factors. On the other hand, eCPM is a metric used to measure the effective revenue for the publisher generated for 1,000 impressions, providing a standard comparison across different advertising channels or platforms.
CTR and CTI (Click-Through Rate and Click to Install)
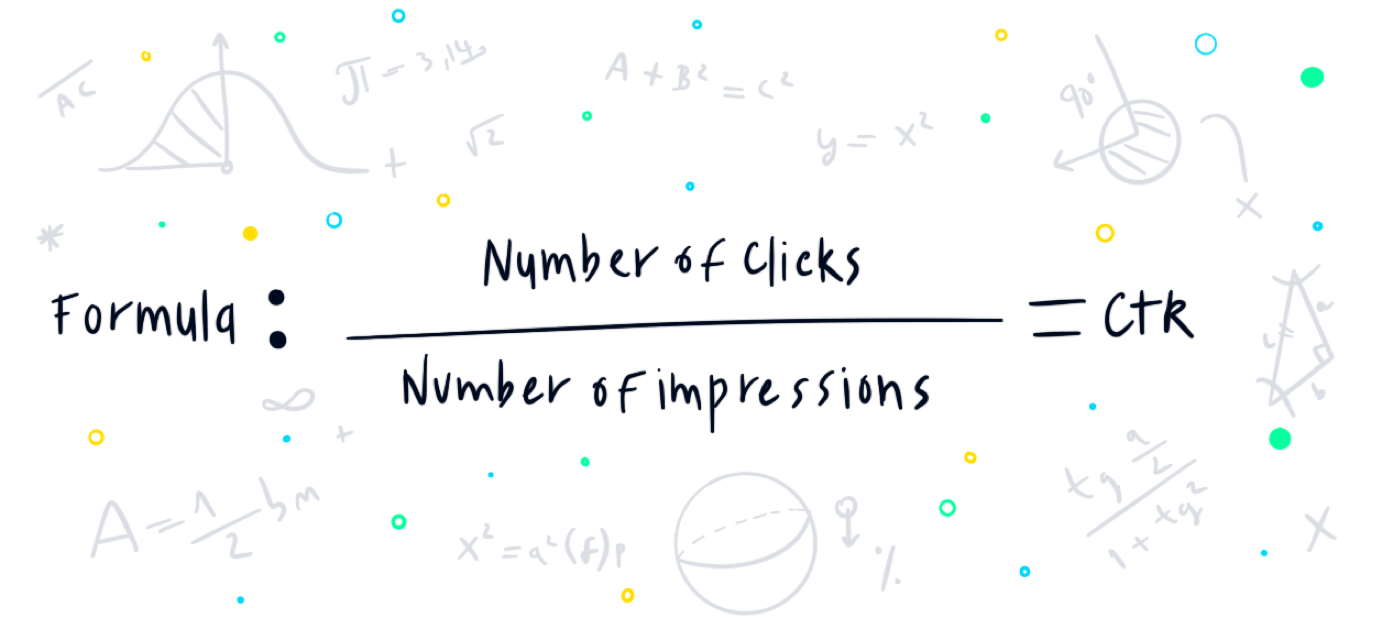
The click-through rate is a favorable marketing KPI. It signifies a stage in the funnel and proves to advertisers that the creative and targeting work, at least to some extent – the ad’s been clicked.
With that being said, in some cases, CTR is given greater gravity than it should. In-app ads work great when they reach their target audience, when they’re well done, and when they’re served at the most opportune time but they’re not as reliable as other metrics.
In-app ads, especially interstitial ads, may be mistakenly clicked more often than others. Simply put, since interstitial ads take up the whole screen, and the close ad sign appears a few seconds into the ad, some clicks are just wrongly clicked, without signifying users’ actual intent.
If this is an issue, it’d result in inflated CTR, which can be confirmed by a decrease in CTI alongside it (it means people are clicking, but have no intention to install, which means the targeting is off).
With more granular data available, KPI goals gear towards performance. While CTR can demonstrate issues relating to creatives and targeting, a metric such as IPM may be more indicative of performance.
IPM (Install Per Mille)

IPM may not have CTR’s reputation, but when it comes to performance-based in-app campaigns, it’s one of the best early indicators of the campaign’s targeting effectiveness.
IPM measures how many users, out of 1000 impressions, installed the app. The higher the IPM, the better. High IPM indicates that your campaign is reaching the right audience and that the creatives are working.
Unlike CTR, IPM is a better metric to estimate users’ intent since an app install is extremely less likely to be accidental than an ad click. With that being said, it does not stand alone. It’s a great early indicator, but a high IPM should be looked at alongside retention rates and other post-install metrics, to ensure quality is not being negatively affected.
Post-install Metrics
Post-install metrics, as we’ve previously mentioned, can be divided into cost-related metrics and value-based metrics. Cost-related metrics, though they’re more down the funnel than pre-install metrics, still serve as early indicators and help estimate the quality of the campaign and the users’ potential.
Post-install metrics are usually measured and tracked through an MMP. They may also be measured and tracked internally, but most developers prefer to rely on 3rd parties than build the substantial infrastructure themselves.
Install to Target Action Rate

Install to target event is the ratio between users who installed and those of them who completed a predefined valuable event. This event can range from completing a level in a game to making a purchase, depending on the relevant app’s main KPIs.
If your aim is to acquire engaged users for a gaming app, your event can be set as completing level 10. On the other hand, if your aim is to have users subscribe to your app, then that may be the predefined event, and so on.
This metric is a strong indicator for gauging value in performance and can provide further insight on other metrics, such as IPM. Through this rate, marketers can verify that the users installing the app are users that, in the future, have the potential to return their investment (an early indication of what their ROAS might be), assuming the predefined event is set in a way that signifies users’ future interactions with the app.
Without diving too deeply into the numbers, setting a target event should be done in an effective way that underlines the bottom-line goals for the app. For example, a 1D deposit for free-to-play gaming apps is usually a good indicator of subsequent deposits and high ROAS, and as such, can be set as an install to action goal and serve as an early indication of the effectiveness of the campaign.
Calculating New User Costs - CPI, CPA, CAC
The cost of a new user can be measured in different ways, depending on the definition of a new user. If you measure a new user by users who installed then CPI will be your metric, but as the industry is shifting more towards down-funnel performance-based campaigns, setting CPA KPIs, and lowering the risk involved in running UA campaigns at scale, is becoming the standard.
Let’s stand on the differences between these 3 metrics:
- CPI (Cost Per Install) is simply calculated by taking the spend and dividing it by the number of installs.
- CPA (Cost Per Action \ Acquisition) is calculated by dividing the spend by the number of actions.
- CAC (Customer Acquisition Cost) is calculated by dividing, once again, the spend in the number of actions. Those actions may be identical to the defined actions in the CPA metric, or they may differ.
These metrics can be aggregated by creatives, campaigns, sources, vendors, and more depending on your purpose of comparison. If you want, for example, to compare the performance of a certain creative, you should measure it against other creatives, preferably from the same vendor and identical spend.
The Difference Between CPA and CAC
CPA can be defined as any action in the app, from completing level 1 to registering, subscribing, making a purchase, and so on. The estimated cost for this action will vary accordingly. For example, an action defined as completing level 1 on a monetization-based game will probably cost significantly less than an action defined as a paid monthly subscription for a service, since it’s relatively less competitive.
CPA can serve marketers as the final goal or as a step along the way. If we continue along with the examples above, the gaming app can set its CPA by a level 1 completion but, in order to calculate its CAC, they’ll look at users who reached level 4 on D1, because it signifies the point from which users start using the app regularly.
For the subscription-based app, they may set both CPA and CAC as the same goal – subscribing to the app, or they may separate between CPA, set as registration, and CAC, set as a subscription, knowing that registration for the free version means they’re likely to convert to a paid subscription.

K-Factor - Estimating Viral Growth
The term K Factor originated in the medicine world, where it was used to describe the spread of a virus (i.e, how infectious it is.) In the mobile marketing world, the context is much more positive, since virality is a positive quality for an app.
K factor, in our context, is used to calculate the ratio between paid users and organic users, that installed the app as a result of running paid campaigns. These organic users may have installed from a known referral, such as a user’s invitation code, or from an unknown source, by simply opening the app store and downloading the app – there are various common ways of calculating it, and depending on how conservative you are in your approach to analysis, you’ll decide if to only measure organic users that can be directly associated with UA or ones that are probabilistically associated with it.
To make things simple, think about starting a UA campaign in a new country (where you have no existing users or a negligible number of users). Your goal is 1,000 paid installs and you start running your paid UA campaign, while also measuring organic installs. By the end of the campaign, you’re left with 1000 paid installs and 100 organic installs (1,100 overall). This means that your paid UA efforts yielded 100 organic installs and that your K factor in that country is 1.1.
The Importance of K Factor
Measuring K Factor helps you
- Gain a better understanding of the effect of your inorganic installs on organic installs (if it’s lower than 1 then there’s room for improvement.)
- Gain insights into how effective or ineffective your in-app sharing capabilities are. Are users utilizing them? How can it be improved?
- Compare your virality between different countries – where it’s working, where it’s not, and what can be improved.
- Get an overall accurate picture of your paid UA efforts. Organic users are usually the best-performing users, and if your paid UA increases the number of these users, it should be taken into account when estimating campaign and acquisition costs.
Much like any data, there’s an abundance of metrics that can be used for measuring and tracking UA campaigns. Marketers should research and realize which metrics are the most valuable for their campaigns and set different key metrics for their different ‘lifetime’ stages (early indicators for the start of the campaign, and value-based for a more advanced campaign, for example).
The goal of a marketing manager should be to effectively choose the most informative KPIs for their use case and use them to deduce where their marketing dollars should go in a very short amount of time.
What’s Next?
For further reading, we recommend these related topics:


Thank you for your interest!
Our team will contact you with more details.